Ecological networks
Daijiang Li
LSU
Announcements
Networks are everywhere
Networks are everywhere
social network
Networks are everywhere
social network
transportation network
Networks are everywhere
social network
transportation network
power grid network
Networks are everywhere
social network
transportation network
power grid network
information network
Internet Routers Internet connections Undirected 192,244 609,066 6.34 WWW Webpages Links Directed 325,729 1,497,134 4.60 Power Grid Power plants, transformers Cables Undirected 4,941 6,594 2.67 Mobile-Phone Calls Subscribers Calls Directed 36,595 91,826 2.51 Email Email addresses Emails Directed 57,194 103,731 1.81 Science Collaboration Scientists Co-authorships Undirected 23,133 93,437 8.08 Actor Network Actors Co-acting Undirected 702,388 29,397,908 83.71 Citation Network Papers Citations Directed 449,673 4,689,479 10.43 E. Coli Metabolism Metabolites Chemical reactions Directed 1,039 5,802 5.58 Protein Interactions Proteins Binding interactions Undirected 2,018 2,930 2.90
Network & Graph
| Network Science | Graph Theory |
|---|---|
| Network | Graph |
| Node (N) | Vertex (V) |
| Link (L) | Edge (E) |
Ecological Networks
(Pocock et al. 2016)
Why ecological networks?
what is ecology? networks as a natural way to connect interactive species be able to handle complex systems analytical tools to detect system level structure and species level contributions
Network types
- unipartite
- weighted?
- directed?
- bipartite
- weighted?
- directed?
 Delmas et al. 2019
Unipartite networks
Interactions between nodes of the same class
social contact network (e.g., contact tracing, target vaccination)
species co-occurrence network (e.g., metapopulations, community assembly/disassembly)
www (e.g., information flow, fraud prevention)
Bipartite networks
Interactions between two classes of nodes
Host-parasite
Predator-prey
Plant-pollinator
Different
visualizations
of the same
network
(Pocock et al.
2016)
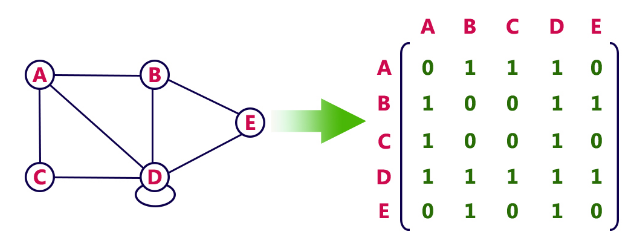
Adjacency matrix
Common measures of networks
Order (S): the total number of nodes
Common measures of networks
Order (S): the total number of nodes
Size (L): the total number of links (interactions)
Common measures of networks
Order (S): the total number of nodes
Size (L): the total number of links (interactions)
Linkage density: L/S
Common measures of networks
Order (S): the total number of nodes
Size (L): the total number of links (interactions)
Linkage density: L/S
Connectance (Co): L/m (m: possible number of interactions)
the connectance range: 0-1
Common measures of networks
Degree: the number of links a node has to other nodes; ki to be the degree of the i th node in the network
Common measures of networks
Degree: the number of links a node has to other nodes; ki to be the degree of the i th node in the network
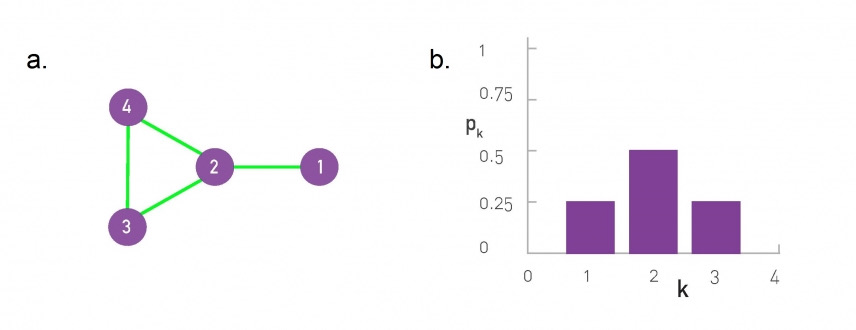
Degree distribution P(k): the probability that a species has k interactions within the network. P(k) = N(k)/S.
The degree distribution plays a central role in network theory with the calculation of most network properties requires us to know P(k)
Common measures of networks
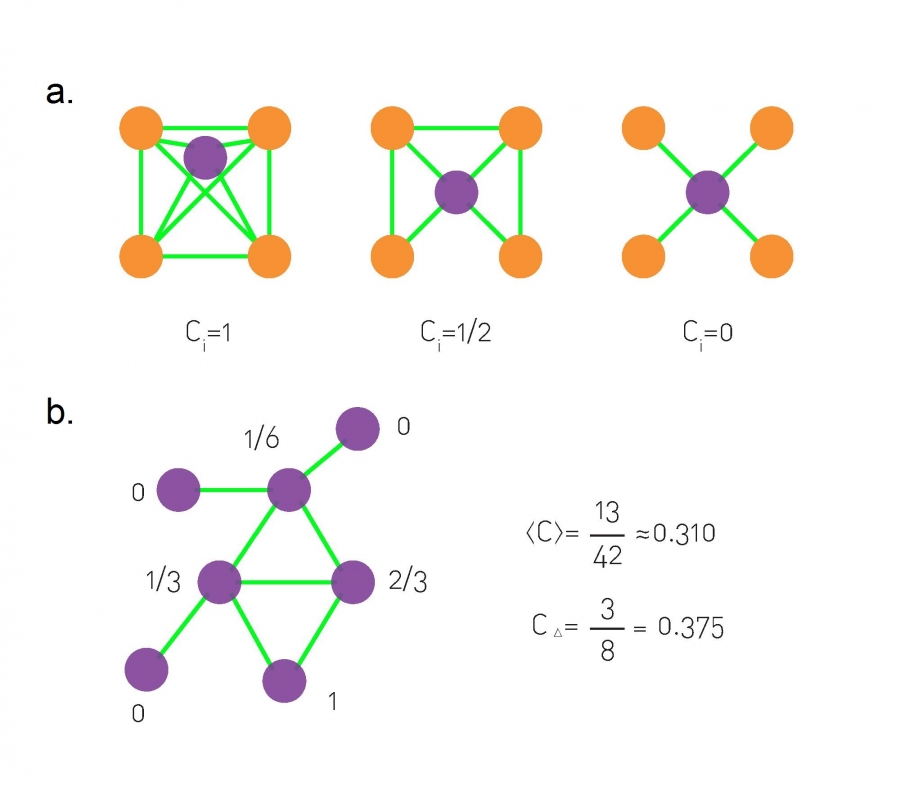
Clustering coefficient (CC): the degree to which the neighbors of a given node link to each other.
CCi=2NiKi(Ki−1)
Common measures of networks
Modularity: how closely connected nodes are divided into modules
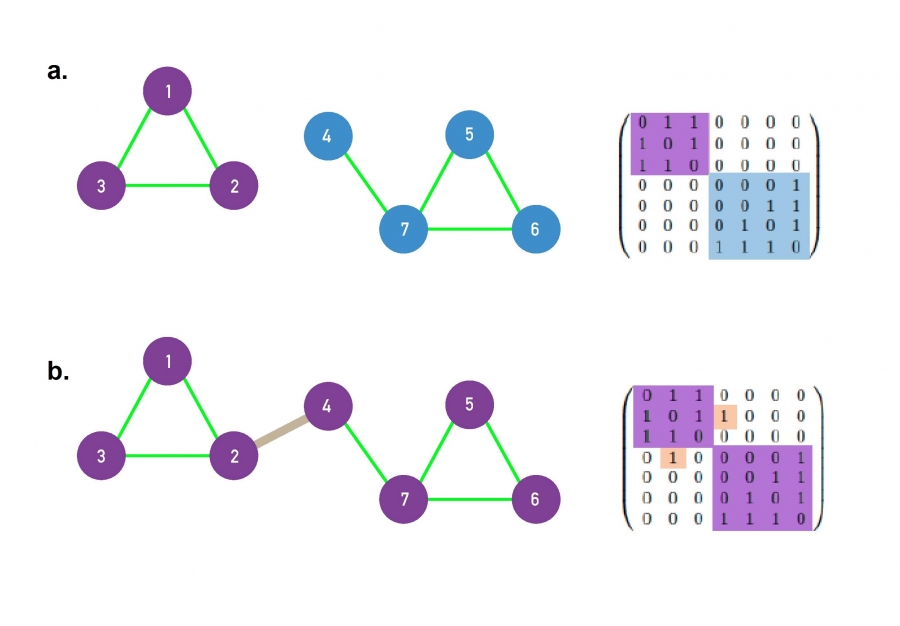
Common measures of networks
Nestedness: the tendency for species with fewer interactions to be a subset of those with more interactions
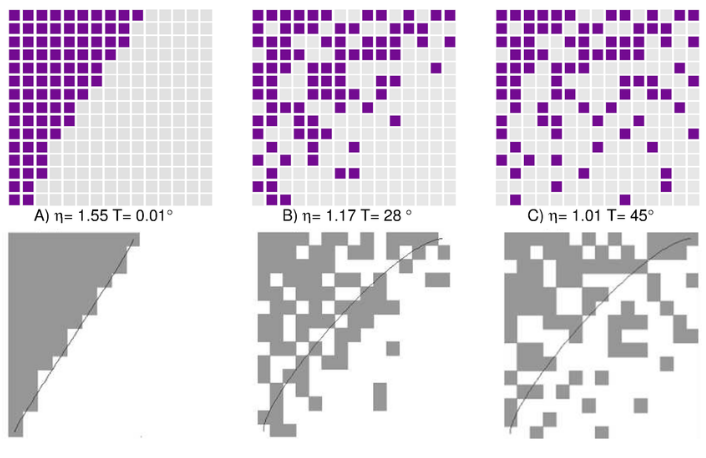
Pocock et al. 2016
Common measures of networks
Centrality: the importance of a node in the network; many different types to measure centrality: degree, closeness, betweenness, eigenvector, and Katz’s covered in Delmas et al. (2019)
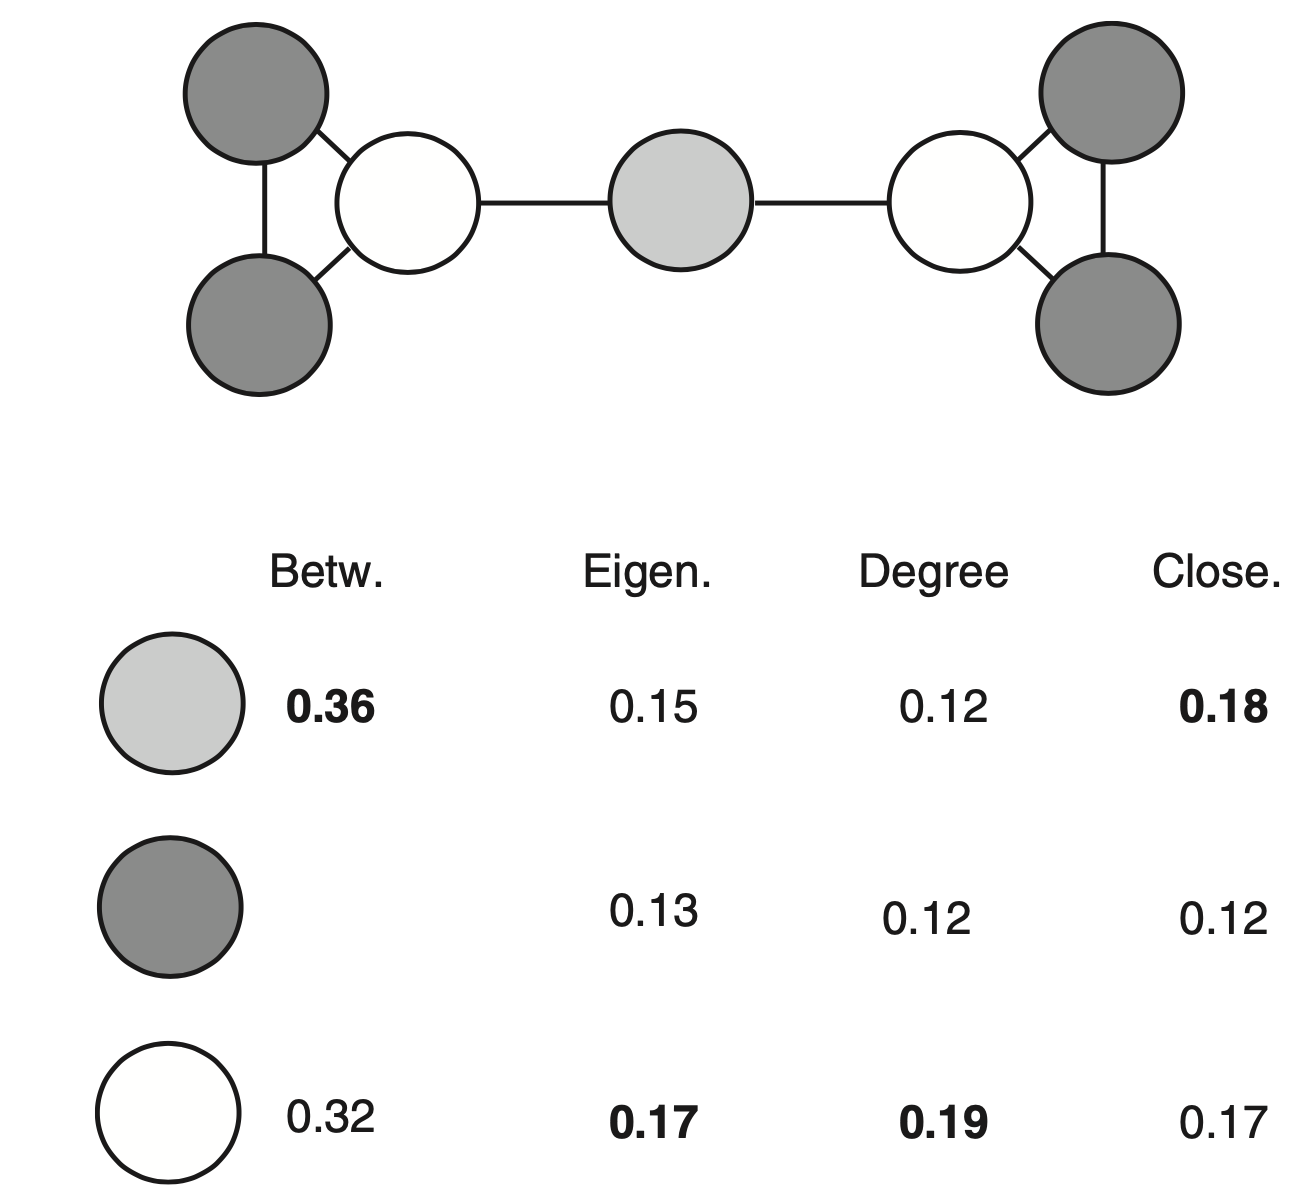
degree: just number of interactions closeness: global scale, the proximity of a species to all other species in the network, account the structure of the whole network
Common measures of networks
Contribution to network properties
Ci=P−¯Piσ¯Pi
Common measures of networks
Contribution to network properties
Ci=P−¯Piσ¯Pi
Error tolerance and attack tolerance
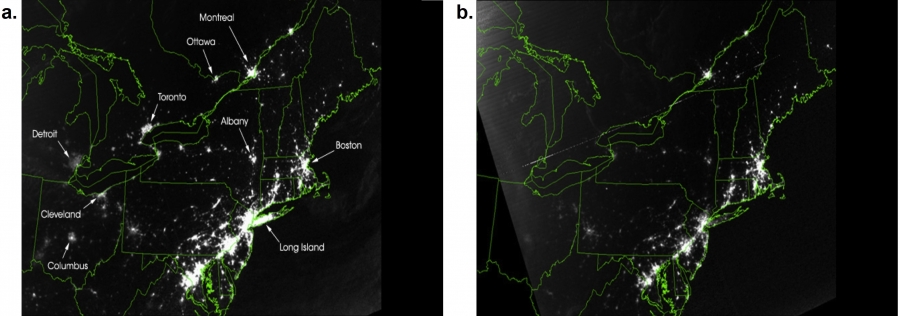
Error tolerance refers to the ability of a network to recover from the loss of a node
attack tolerance: the robustness of a network to a targeted attack
negative relationships between them
Common measures of networks
Compare different nodes and different networks
Nodes
J(A,B)=|A∩B||A∪B|
Common measures of networks
Compare different nodes and different networks
Nodes
J(A,B)=|A∩B||A∪B|
Networks
